How to Save a Graph in Excel (Easiest Way in 2025)
In this article, we will show you how to save a graph in Excel. Simply follow the steps below!
Method 1: How to Save a Graph from Excel Using Copy and Paste
Here’s how to save a graph from Excel using the copy and paste method:
1. Select the Graph
Click on the chart to select it. Make sure the entire chart area is highlighted.
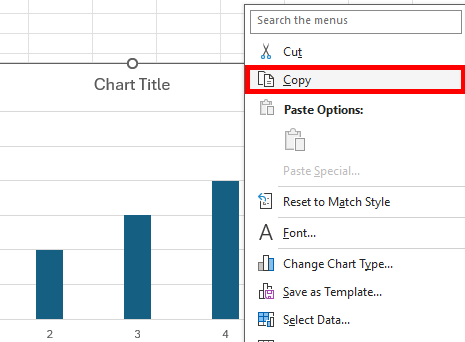
2. Copy the Graph
Right-click on the selected chart. Choose Copy from the context menu or use the shortcut Ctrl + C (Windows) or Cmd + C (Mac).
3. Open a Graphics Editing Program
Open a graphics editing program such as Microsoft Paint, Adobe Photoshop, or any other image editor.
4. Paste the Graph
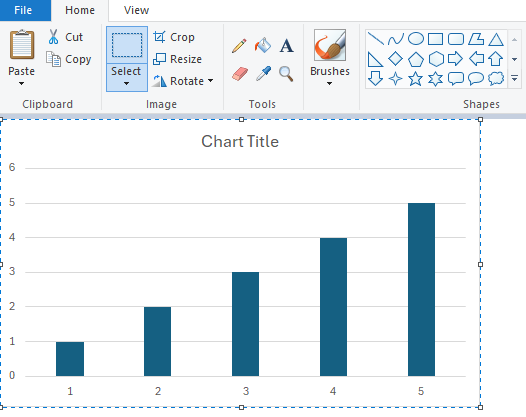
Create a new blank file in your image editor. Paste the copied graph by using Ctrl + V (Windows) or Cmd + V (Mac).
Here’s how the graph looks like in Microsoft Paint:
5. Save the Graph as an Image
Go to the File menu in your image editor. Choose Save As.
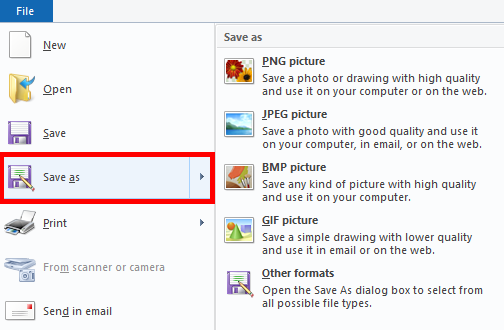
Select your desired file format (e.g., PNG, JPEG, BMP). Name your file and choose the location to save it.

Click Save.

Method 2: How to Save a Graph from Excel Directly
You can also save a graph from Excel directly. Here’s how to do it:
1. Select the Graph
Click on the chart to select it.
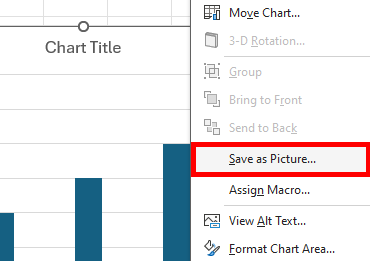
2. Export the Graph
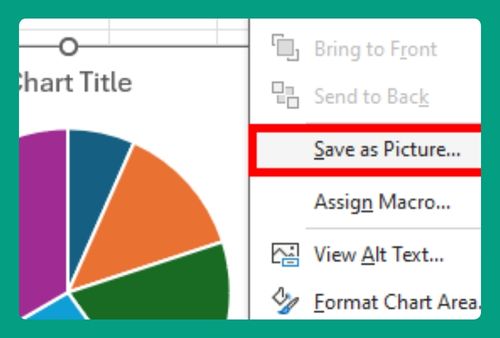
Right-click on the selected chart. Choose “Save as Picture” from the context menu.
3. Choose File Format and Location
In the dialog box that appears, select your desired file format (e.g., PNG, JPEG, BMP). Choose the location where you want to save the image. Enter a name for your file.

4. Save the Graph
Click “Save” to save the graph as an image file in the selected location.

We hope that you now have a better understanding of how to save a graph in Excel. If you enjoyed this article, you might also like our articles on how to save a copy of an Excel file without changing the original and how to save an excel file to Google Drive.