Trend Lines in Excel: The Ultimate Guide for 2024
In this article, we will show you how to add trend lines in Excel. Read on to learn more!
What Are Trend Lines in Excel?
Trend lines in Excel are graphical representations that show the general direction or trend of data over a period of time. They are added to charts to help identify patterns, make predictions, and determine the strength of relationships between variables.
For example, a business analyst might use a trend line on a sales chart to forecast future revenue based on past performance to help in budget planning and resource allocation.
How to Add Trend Lines in Excel
Below we explain step by step how to add trend lines in Excel.
1. Prepare Your Data
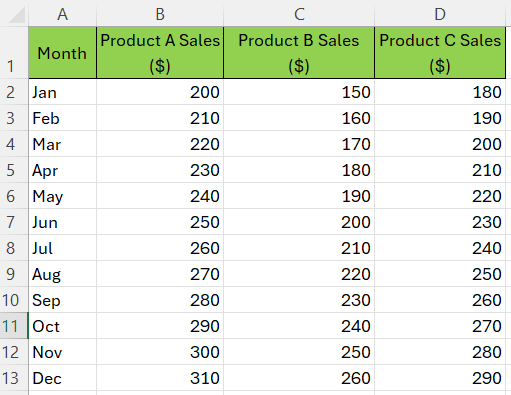
Ensure your data is organized with the independent variable (e.g., time, categories) in one column and the dependent variable (e.g., sales, measurements) in another column.
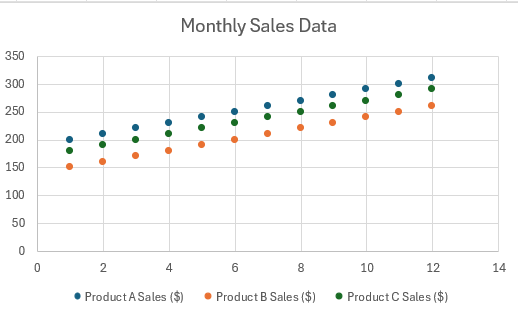
Take for example you have the following monthly sales data for Product A, B, and C:
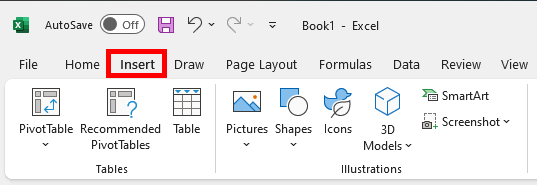
2. Create a Chart
Highlight the data you want to analyze. Go to the “Insert” tab on the Ribbon.
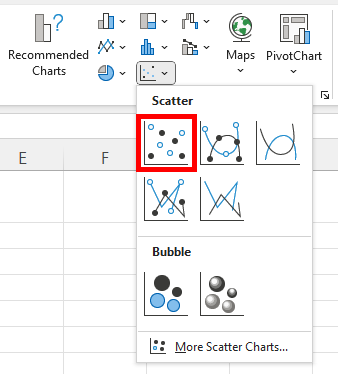
Select the type of chart that best fits your data. Line charts or scatter plots are commonly used when adding trend lines. Click on your preferred chart to insert it into your worksheet.
For this example, we will choose the Scatter Plot.
3. Add a Trend Line
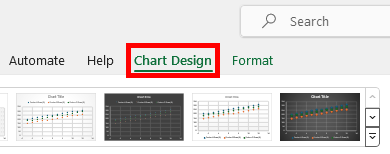
Click on the chart. This will bring up the Chart Tools on the Ribbon. Click on Chart Design.
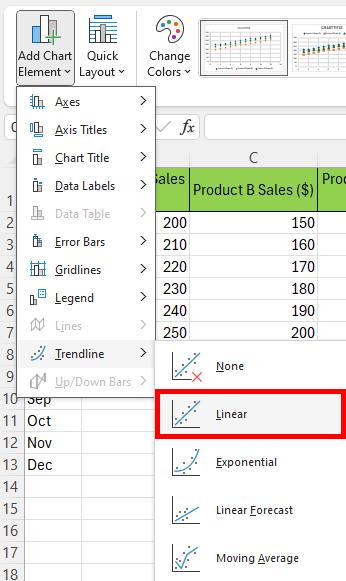
Select Add Chart Element from the toolbar.
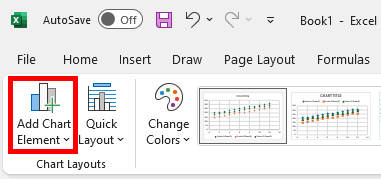
Hover over Trendline and select the type of trend line you wish to add. Options typically include linear, exponential, linear forecast, and moving average. For most linear data sets, choose Linear.
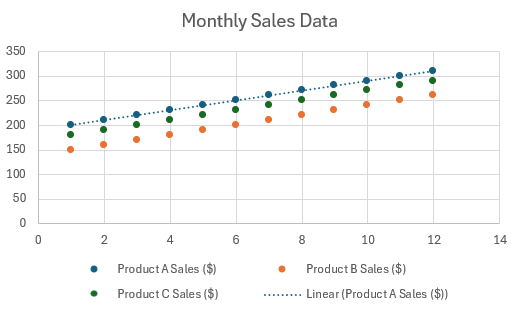
For our example, we added a trendline for our Product A series. Here’s what it looks like:
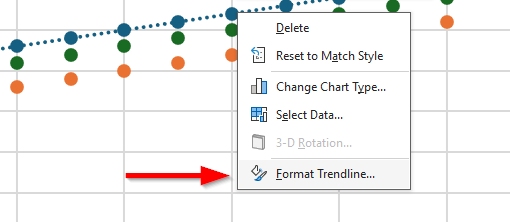
4. Customize the Trend Line
Once the trend line is added, you can format it for better visibility and to display additional information. Right-click on the trend line and select Format Trendline.
We hope that you now have a better understanding of trend lines in Excel. If you enjoyed this article, you might also like our articles on add multiple trendlines in Excel and how to add column sparklines in Excel.