How to Sort a Bar Chart in Excel (Easiest Way in 2025)
In this article, we will show you how to sort an Excel bar chart from largest to smallest. Simply follow the steps below.
Excel Bar Chart: Sort Largest to Smallest
To sort a bar chart in Excel, simply follow the steps below.
1. Insert a Bar Chart
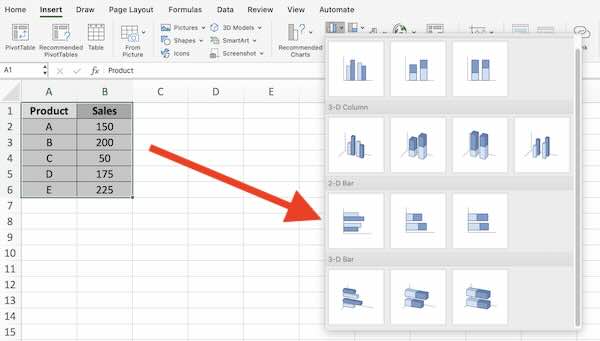
Create a bar chart by selecting your data range. Click on ‘Insert’, then ‘Charts’, and choose ‘Bar Chart’. This inserts a basic bar chart into your worksheet showing sales figures for different products.
2. Sort Data in Your Table
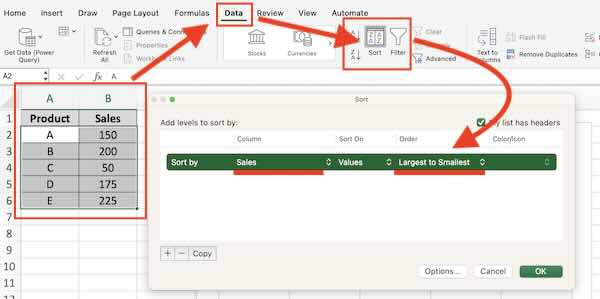
Sort your data directly in the table to affect the chart. Go to ‘Data’, then ‘Sort & Filter’, and choose to sort by the ‘Sales’ column from largest to smallest.
3. Observe Chart Update
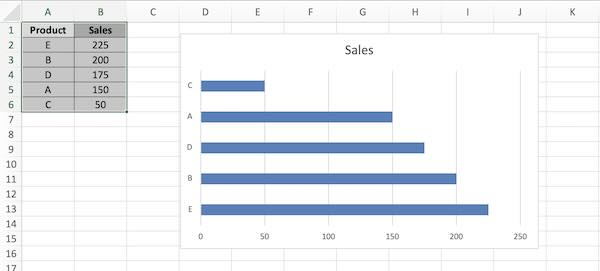
After sorting the data in the table, the chart will automatically update to reflect the changes. The bars will reorder to display from highest to lowest sales.
We hope you now have a better understanding of how to sort a bar chart in Excel. If you enjoyed this article, you might also like our article on overlapping bar charts in Excel or our article on how to add horizontal error bars in Excel.

