How to Add Horizontal Error Bars in Excel (Easiest Way in 2025)
In this article, we will show you how to add horizontal error bars in Excel. Simply follow the steps below.
Insert Horizontal Error Bars in Excel
To add horizontal error bars in Excel, follow these steps:
1. Prepare Your Data
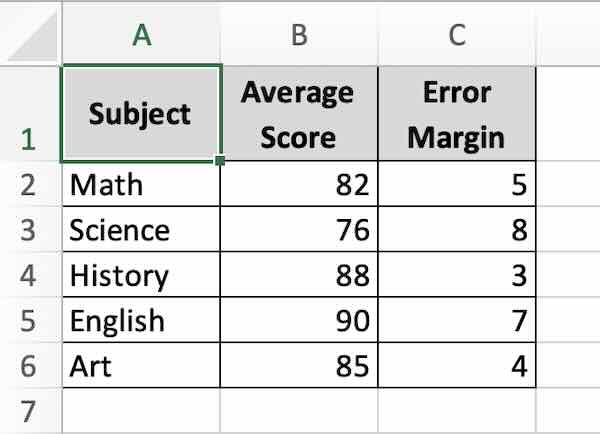
First, organize your data in Excel. For our example, list the subjects in one column and their corresponding average scores in another. Make sure you also have a column for the error values, which represent the margin of error for each score.
2. Insert a Bar Chart
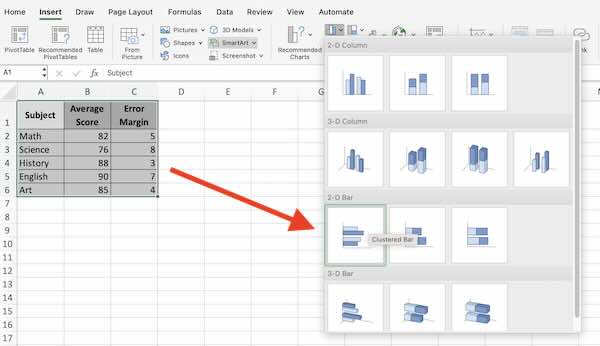
Select only the columns with subjects and average scores (not the error values). Go to the ‘Insert’ tab and choose a bar chart from the ‘Charts’ group. This will display the average scores across different subjects.
3. Add Error Bars
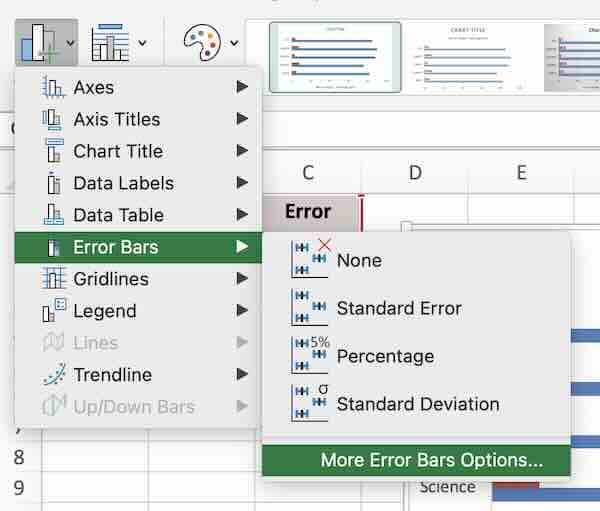
With your chart selected, go to the Chart Design tab on the Excel ribbon. Click on ‘Add Chart Element,’ then hover over ‘Error Bars’ and select ‘More Error Bars Options.’

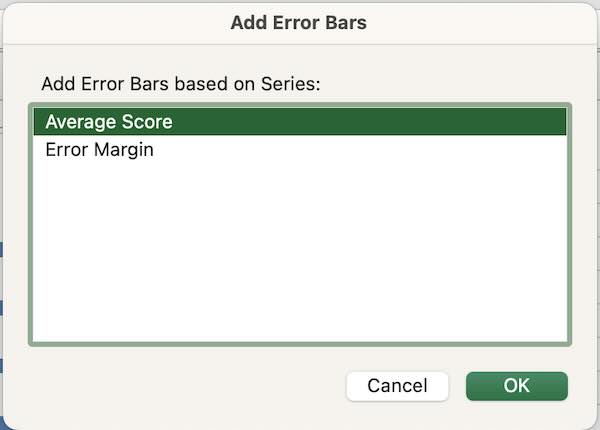
From the ‘Add Error Bars’ dialogue box, choose ‘Average Score.’
4. Customize Error Bars
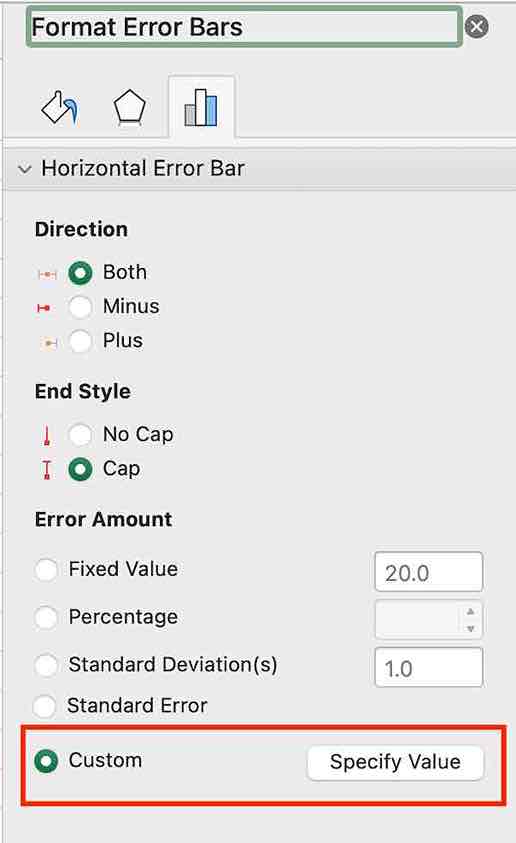
In the ‘Format Error Bars’ pane, choose ‘Custom’ under ‘Error Amount’ and click ‘Specify Value.’
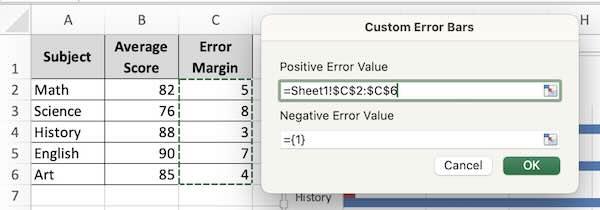
Enter the range of your error margins for the ‘Positive Error Value’ and ‘Negative Error Value.’ This will apply the error bars horizontally across the average scores in our chart.
5. Review and Adjust
Finally, review your chart to ensure the error bars correctly represent the variability in your data. Make any necessary adjustments to improve clarity and visual appeal.

We hope you now have a better understanding of how to add horizontal error bars in Excel. If you enjoyed this article, you might also like our article on how to sort bar charts in descending order in Excel or our article on how to remove horizontal error bars in Excel.

