How to Save an Excel Chart as an Image (Easiest Way in 2025)
In this article, we will show you how to save an Excel chart as an image. Simply follow the steps below!
Save Excel Chart as Image
Follow the process below to save an Excel graph as an image using copy and paste and saving a chart directly from Excel.
Method 1: How to Save a Chart in Excel Using Copy and Paste
Here’s how to save a chart in Excel using copy and paste:
1. Open Excel and Select Your Chart
Open your Excel workbook and navigate to the worksheet containing the chart you want to save. Click on the chart to select it.
2. Copy the Chart
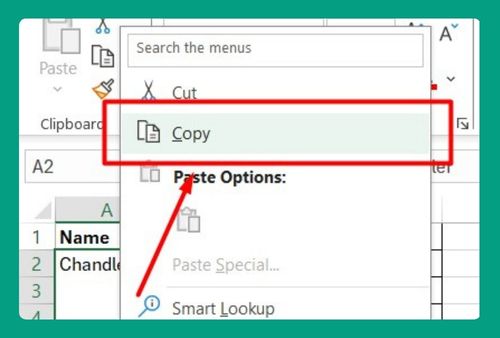
Right-click on the chart and select Copy from the context menu. Alternatively, you can press Ctrl + C on your keyboard.

3. Open a Graphics Program
Open a graphics program like Microsoft Paint, Adobe Photoshop, or any image editing software of your choice.
4. Paste the Chart
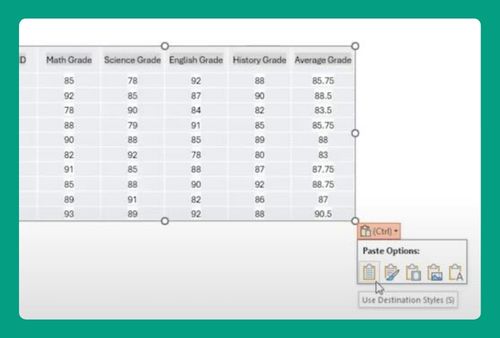
In your graphics program, open a new file (if required). Right-click and select Paste or press Ctrl + V on your keyboard to paste the copied chart.
For simplicity and for the purpose of this guide, we used Microsoft Paint.

5. Save the Image
Once the chart is pasted, go to the File menu and select Save As. Choose the desired file format (e.g., PNG, JPEG) and select the location where you want to save the image.

Method 2: How to Save a Chart Directly from Excel
Alternatively, you can also follow the steps below to save a chart directly from Excel. Note that this only works for Excel 2013 and later:
1. Save as Picture
Right-click on the selected chart. From the context menu, select Save as Picture.

2. Choose File Format and Location
In the Save As dialog box, enter a name for the file and choose the desired file format (e.g., PNG, JPEG).

Select the location where you want to save the image. Click Save.

We hope that you now have a better understanding of how to save an Excel chart as an image. If you enjoyed this article, you might also like our articles on how to save Excel sheets as separate files and how to recover unsaved changes in Excel.


