How to Show Percentage in Bar Chart in Excel (2025 Guide)
In this article, we will show you how to add percentage data labels in an Excel bar chart. Read on to learn more!
How to Make a Bar Chart in Excel with Percentages
To show percentages in a bar chart in Excel, simply follow these steps:
1. Organize Your Data in Excel
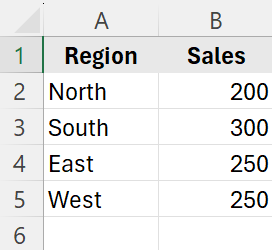
First, organize your data in Excel. For our example, you’ll need two columns: one for the categories (Regions) and one for the values (Sales). Here’s an example:
2. Calculate the Percentage Contribution
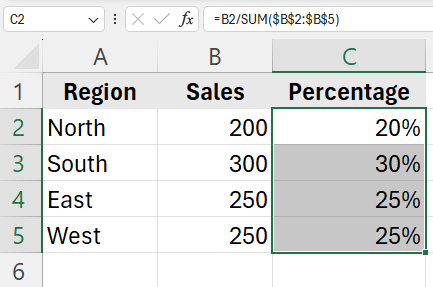
Next to the sales data, add a column to calculate the percentage each region contributes. Use the formula =B2/SUM($B$2:$B$5) for the first cell and drag it down to apply it to other cells.
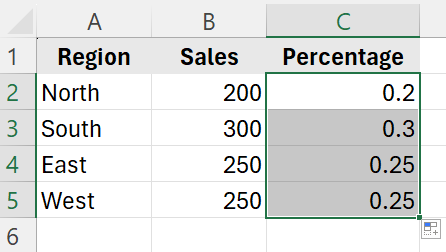
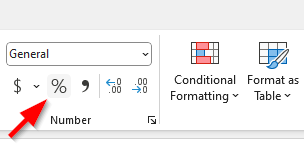
If the values show up as decimals, format them as a percent by clicking on the percent sign in the “Number” section under the “Home” tab.
Here’s what our dataset looks like:
3. Select Your Data Range to Create the Bar Chart
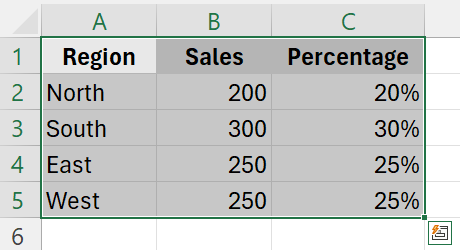
Select the data range that includes the Regions and their corresponding Percentages. In our example, select from A1 to C5.
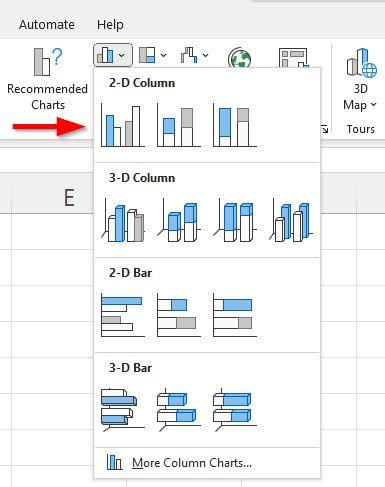
Go to the “Insert” tab in the Ribbon. Click on the Bar Chart icon in the Charts group. Choose a simple 2D Bar Chart from the options.
4. Customize the Bar Chart
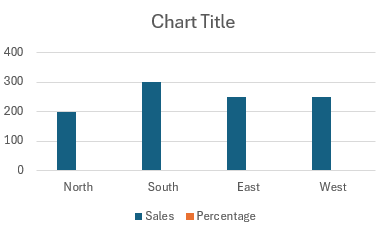
Click on the chart to activate the Chart Tools on the Ribbon. Use the “Chart Design” and “Format” tabs to modify the chart title, labels, and colors as needed.
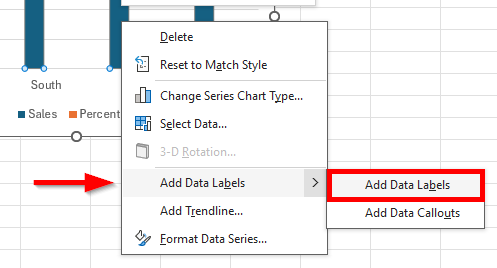
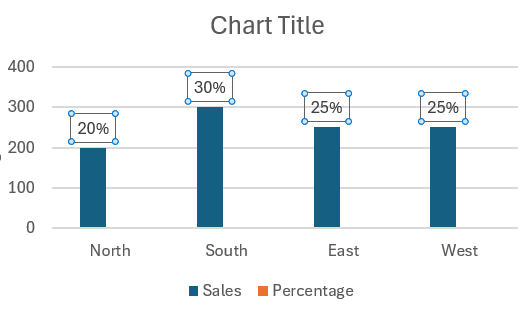
To display percentages on the chart bars, click on the bars, then click “Add Data Labels”, and finally “Add Data Labels” again.
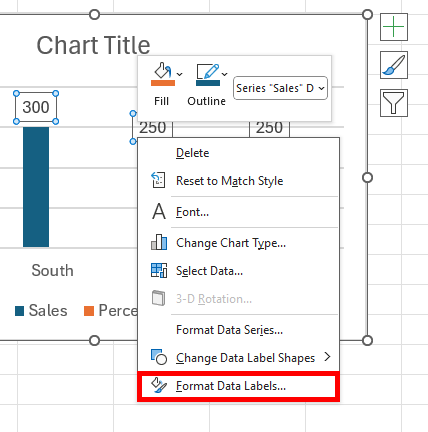
Now, right-click on the labels, choose “Format Data Labels”.
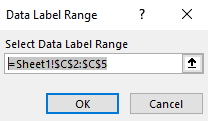
Select “Value From Cells” and specify the cells containing the percentages. In our example, it would be =Sheet1!$C$2:$C$5. Click “OK”.
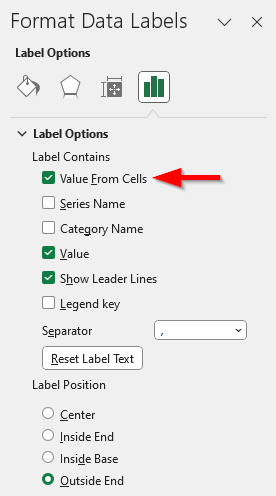
You can uncheck “Value” under Label Options so only the percentages are displayed in the bar chart.
We hope that you now have a better understanding of how to add percentage data labels in an Excel bar chart. If you enjoyed this article, you might also like our articles on how to pin an Excel file to your taskbar and how to show numbers and percentages in an Excel bar chart.

